1 Flow diagram of database construction
2 The main interface of the database
2.1 Condition-specific gene expression profiles
1 Flow diagram of database construction
2 The main interface of the database
2.1 Condition-specific gene expression profiles
1 Flow diagram of database construction
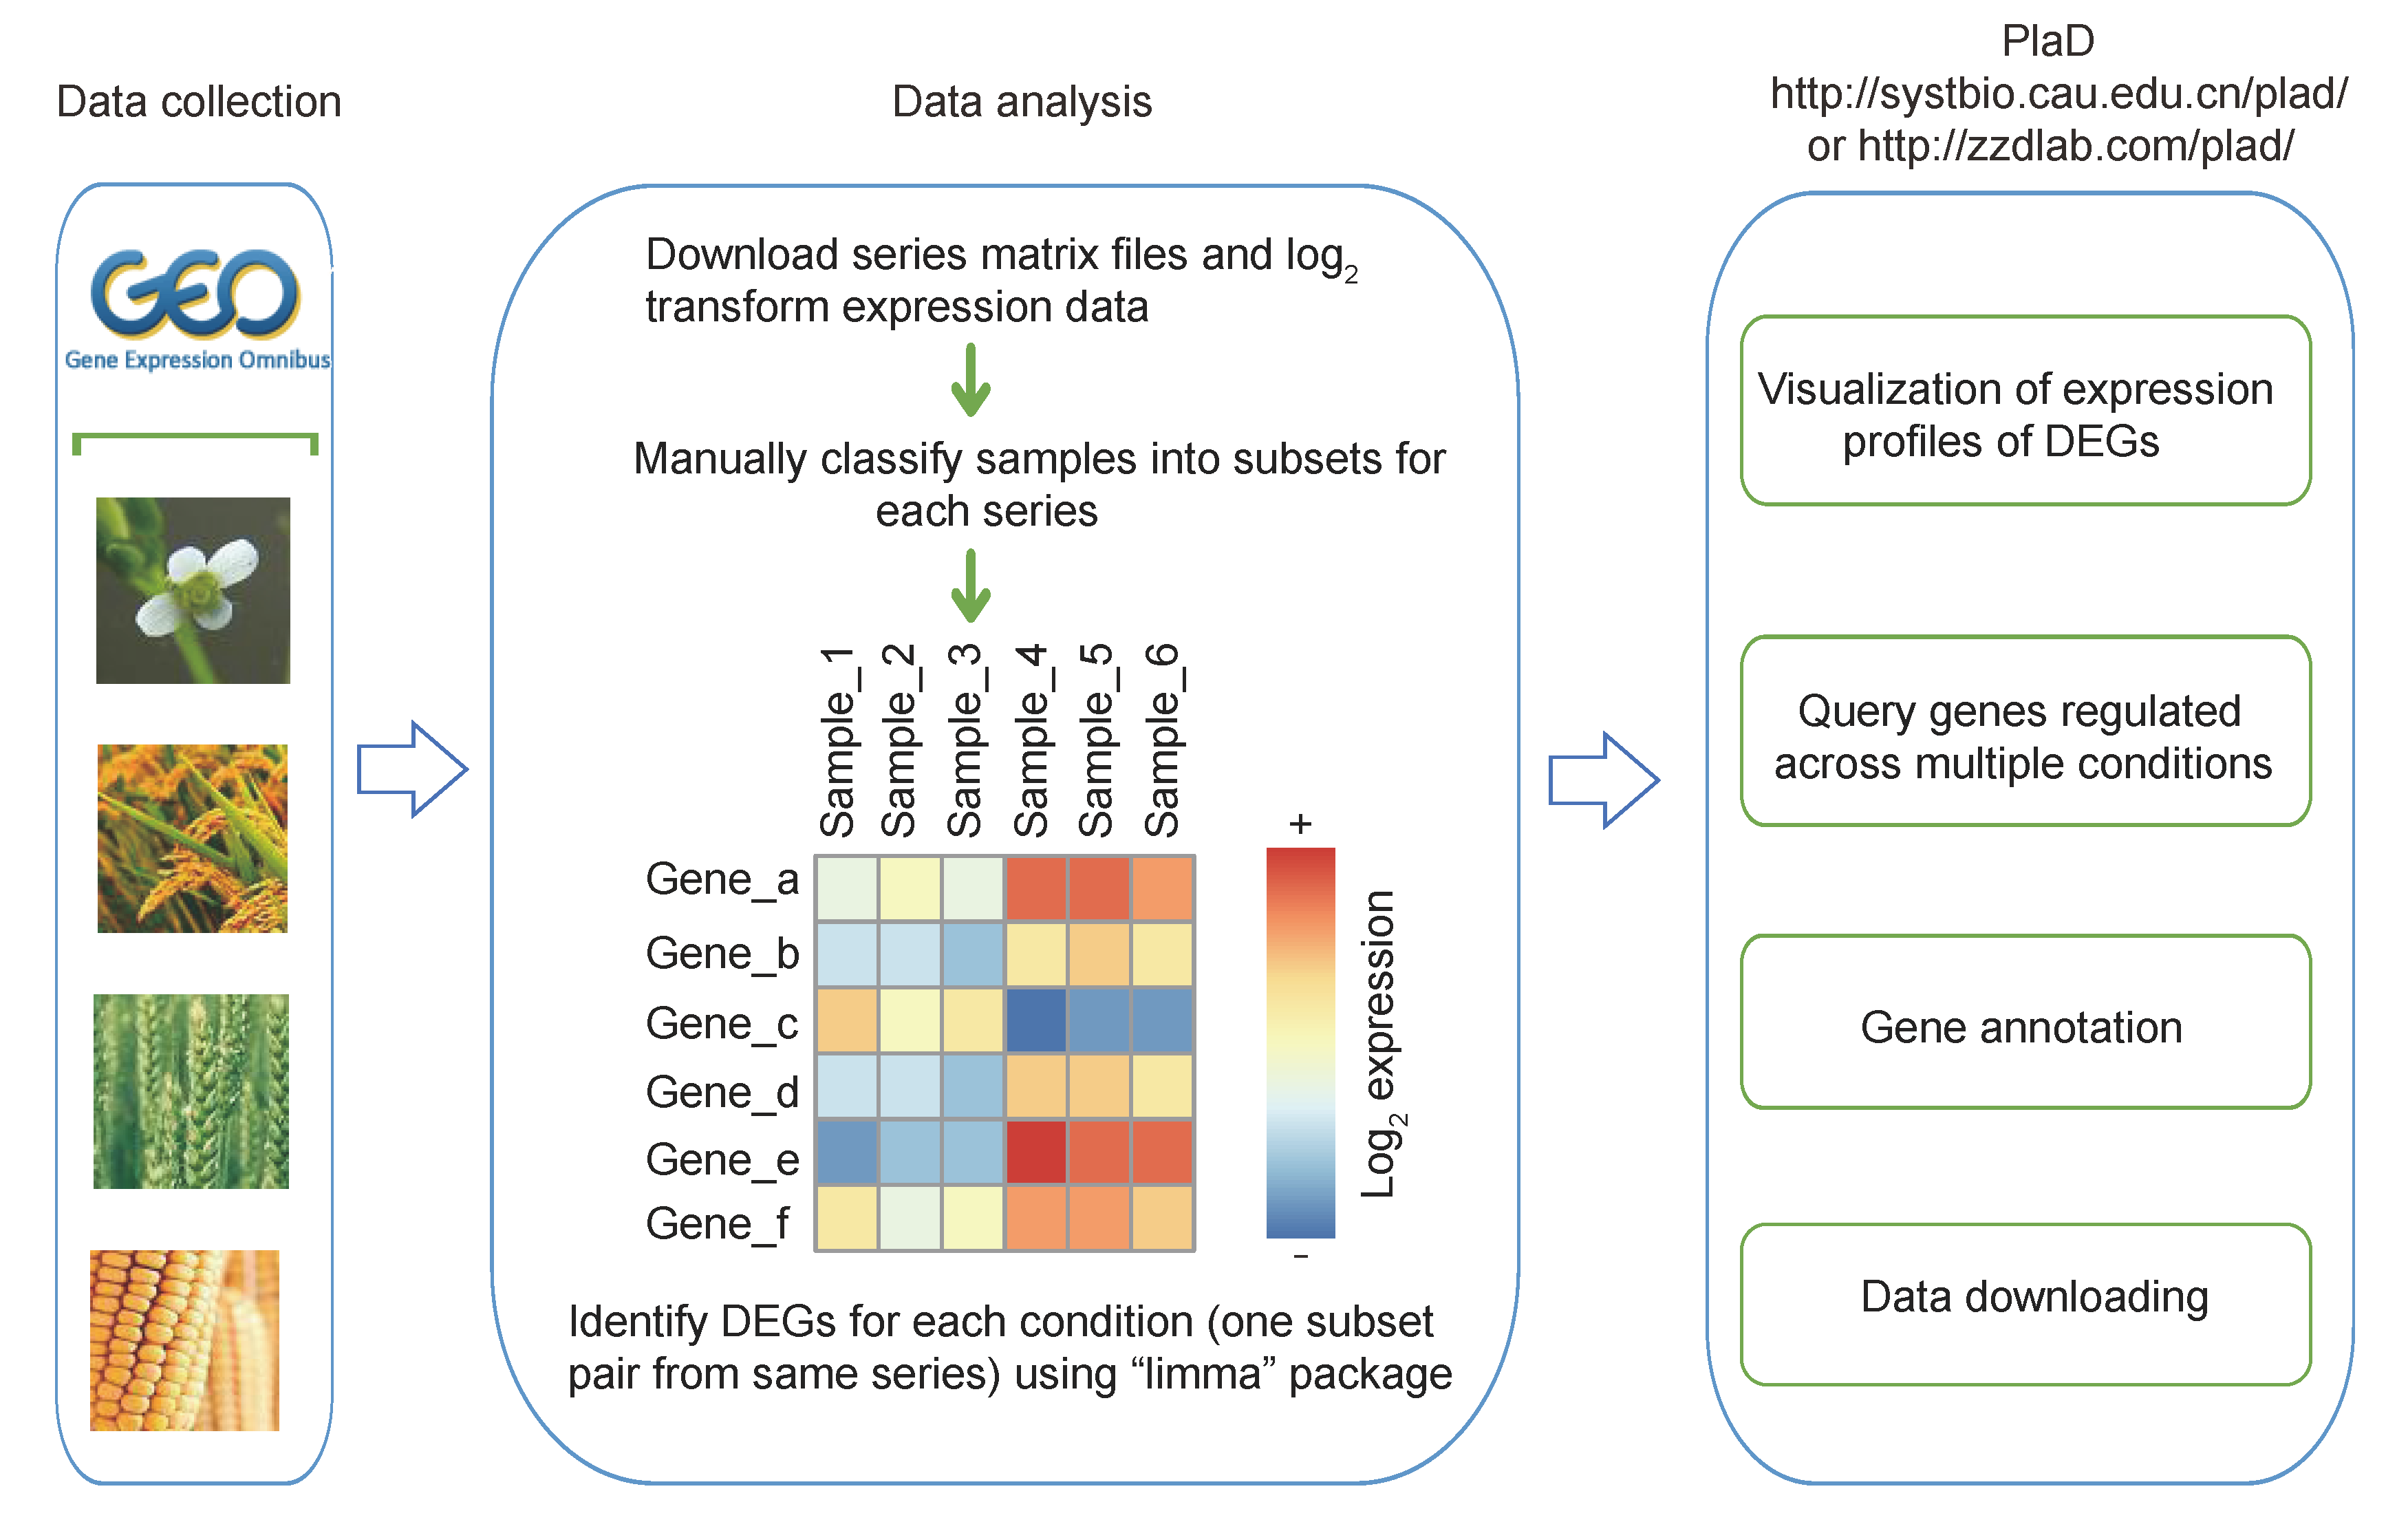
2 The main interface of the database
2.1 Condition-specific gene expression profiles
Step1. Select one series according to plant species or pathogen type (#1).
We collected the microarray data of Arabidopsis thaliana, Oryza sativa, Triticum aestivum and Zea mays infected with pathogens from GEO, and classified series based on plant tissues and pathogen types. For example, the tissues of Oryza sativa contain aerial tissue, leaves, roots, shoots and whole organisms. The rice-infecting pathogen types consist of bacteria, fungi and viruses. In this step, users can choose series according to this order "bacteria--Xanthomonas oryzae pv. oryzicola--GSE16793", and detail information of series will be shown on upper-right of page (#3). The information of a GSE series includes cultivar, tissue of plant and related pathogen.
Step2. Select a condition-specific subset pair that users focus on (#2).
After users select one group, the web page will display condition-specific expression profile (#4)
. We analyze differentially expressed genes (DEGs) using Limma (an R language package), and choose absolute log2 fold change (FC) >=1.5 and adjusted P value (P value adjusted after multiple testing) <0.05 as cutoff value.
Visualization of condition-specific expression profile consists of the following parts: (1)
users can selectively display up-regulated genes, down-regulated genes or all DEGs; (2) users can sort the DEGs in different ways: DEG name, log2 FC of gene and adjusted P value;
(3) row labels of heatmap links to gene detail information page, column labels with external link property can link to GEO, and classification bars under column labels can help users distinguish control and treatment (#5);
(5) the download function of DEGs expression profile is also provided, and the downloadable file contains DEGs and the corresponding expression value, log2 FC and the adjusted P value of DEGs.

2.2 Gene detail information
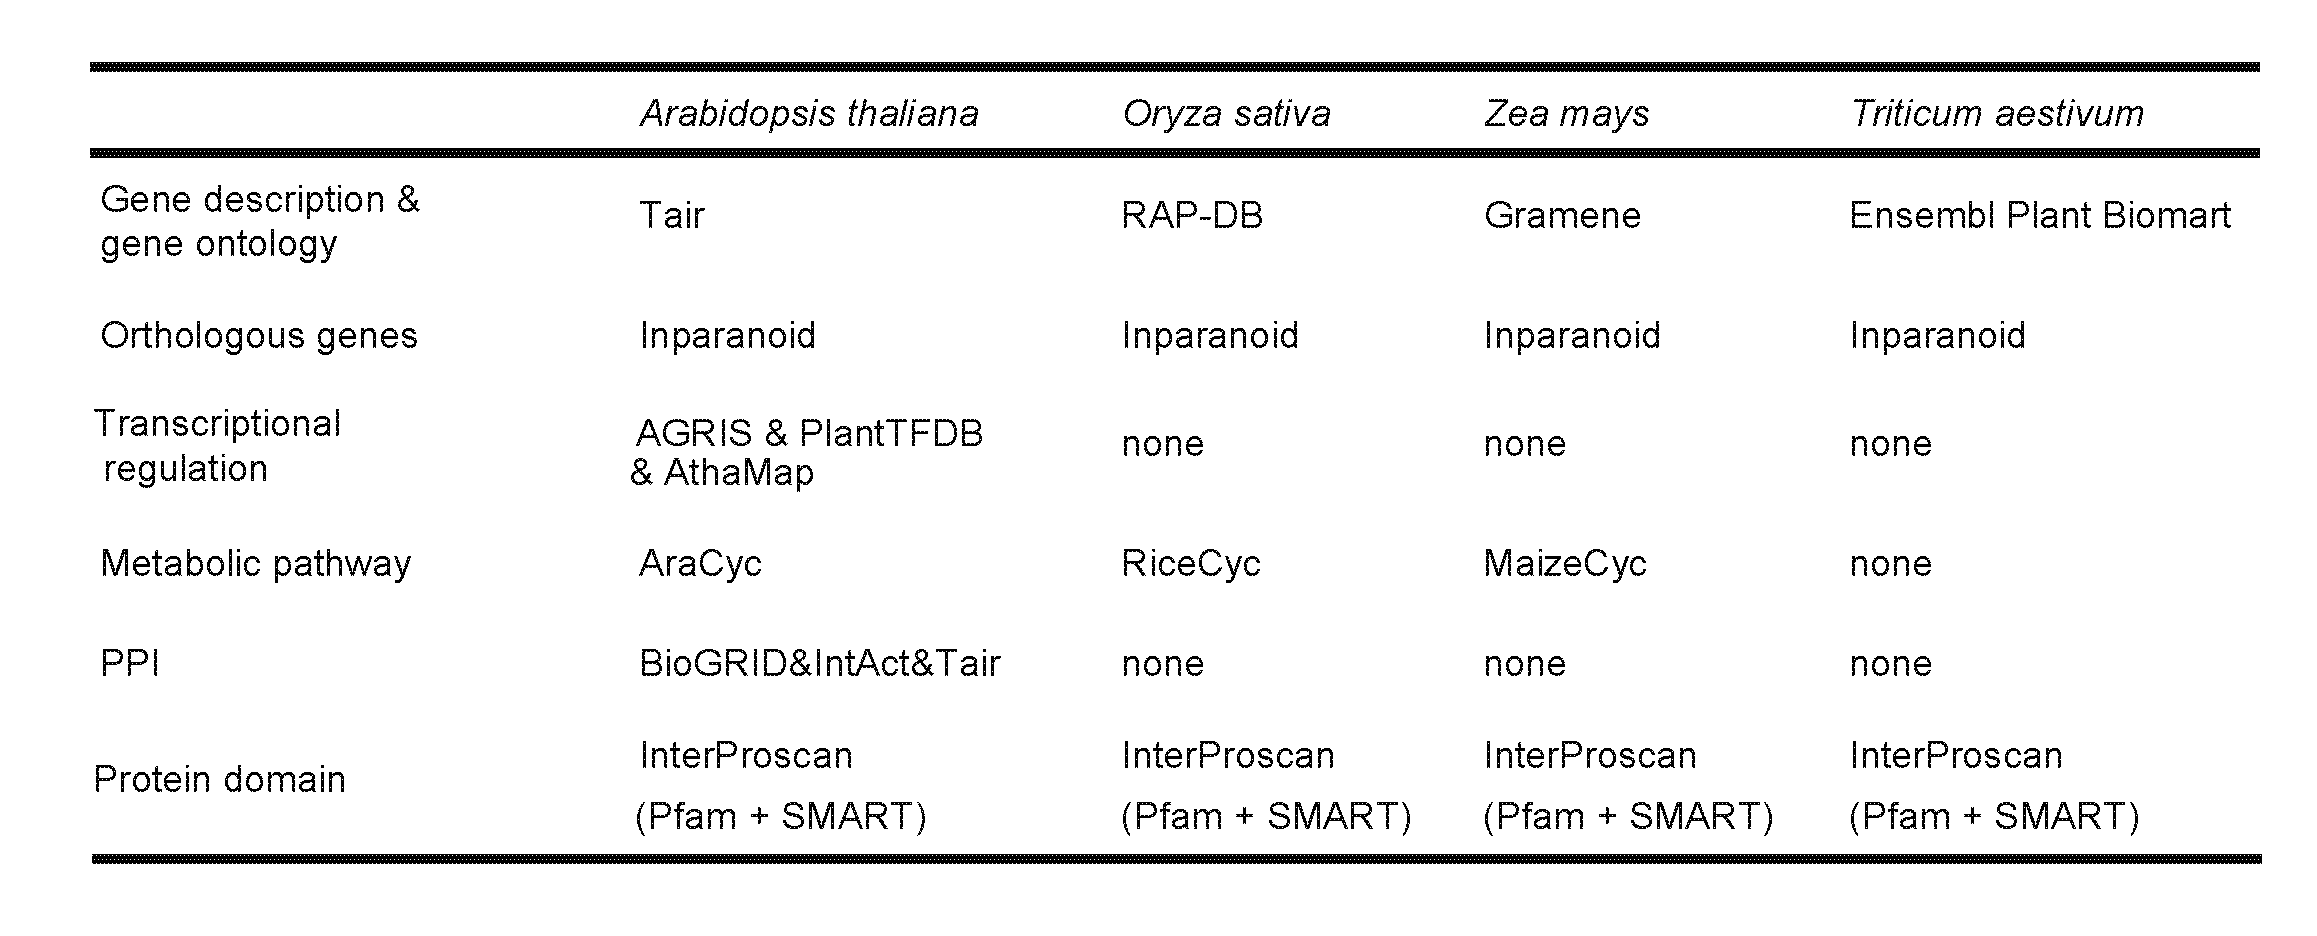
Genes were annotated from several aspects. For example, the gene annotation of Arabidopsis thaliana consists of gene short description, links to TAIR, gene ontology annotation, orthologous genes, metabolic pathways, transcriptional regulation, protein-protein interactions, co-expression networks and differentially expressed conditions (only focus on pathogen-specific subset pairs). Data sources and software for the gene annotation of Arabidopsis thaliana, Oryza sativa, Triticum aestivum and Zea mays are listed in the following table.
It is worth mentioning that associated co-expression network is provided for predicting potential functions of the query gene. A colour scheme based on the consistency_scores of genes was used in the network representation, and GO enrichment analysis was conducted to co-expressed genes of query gene.
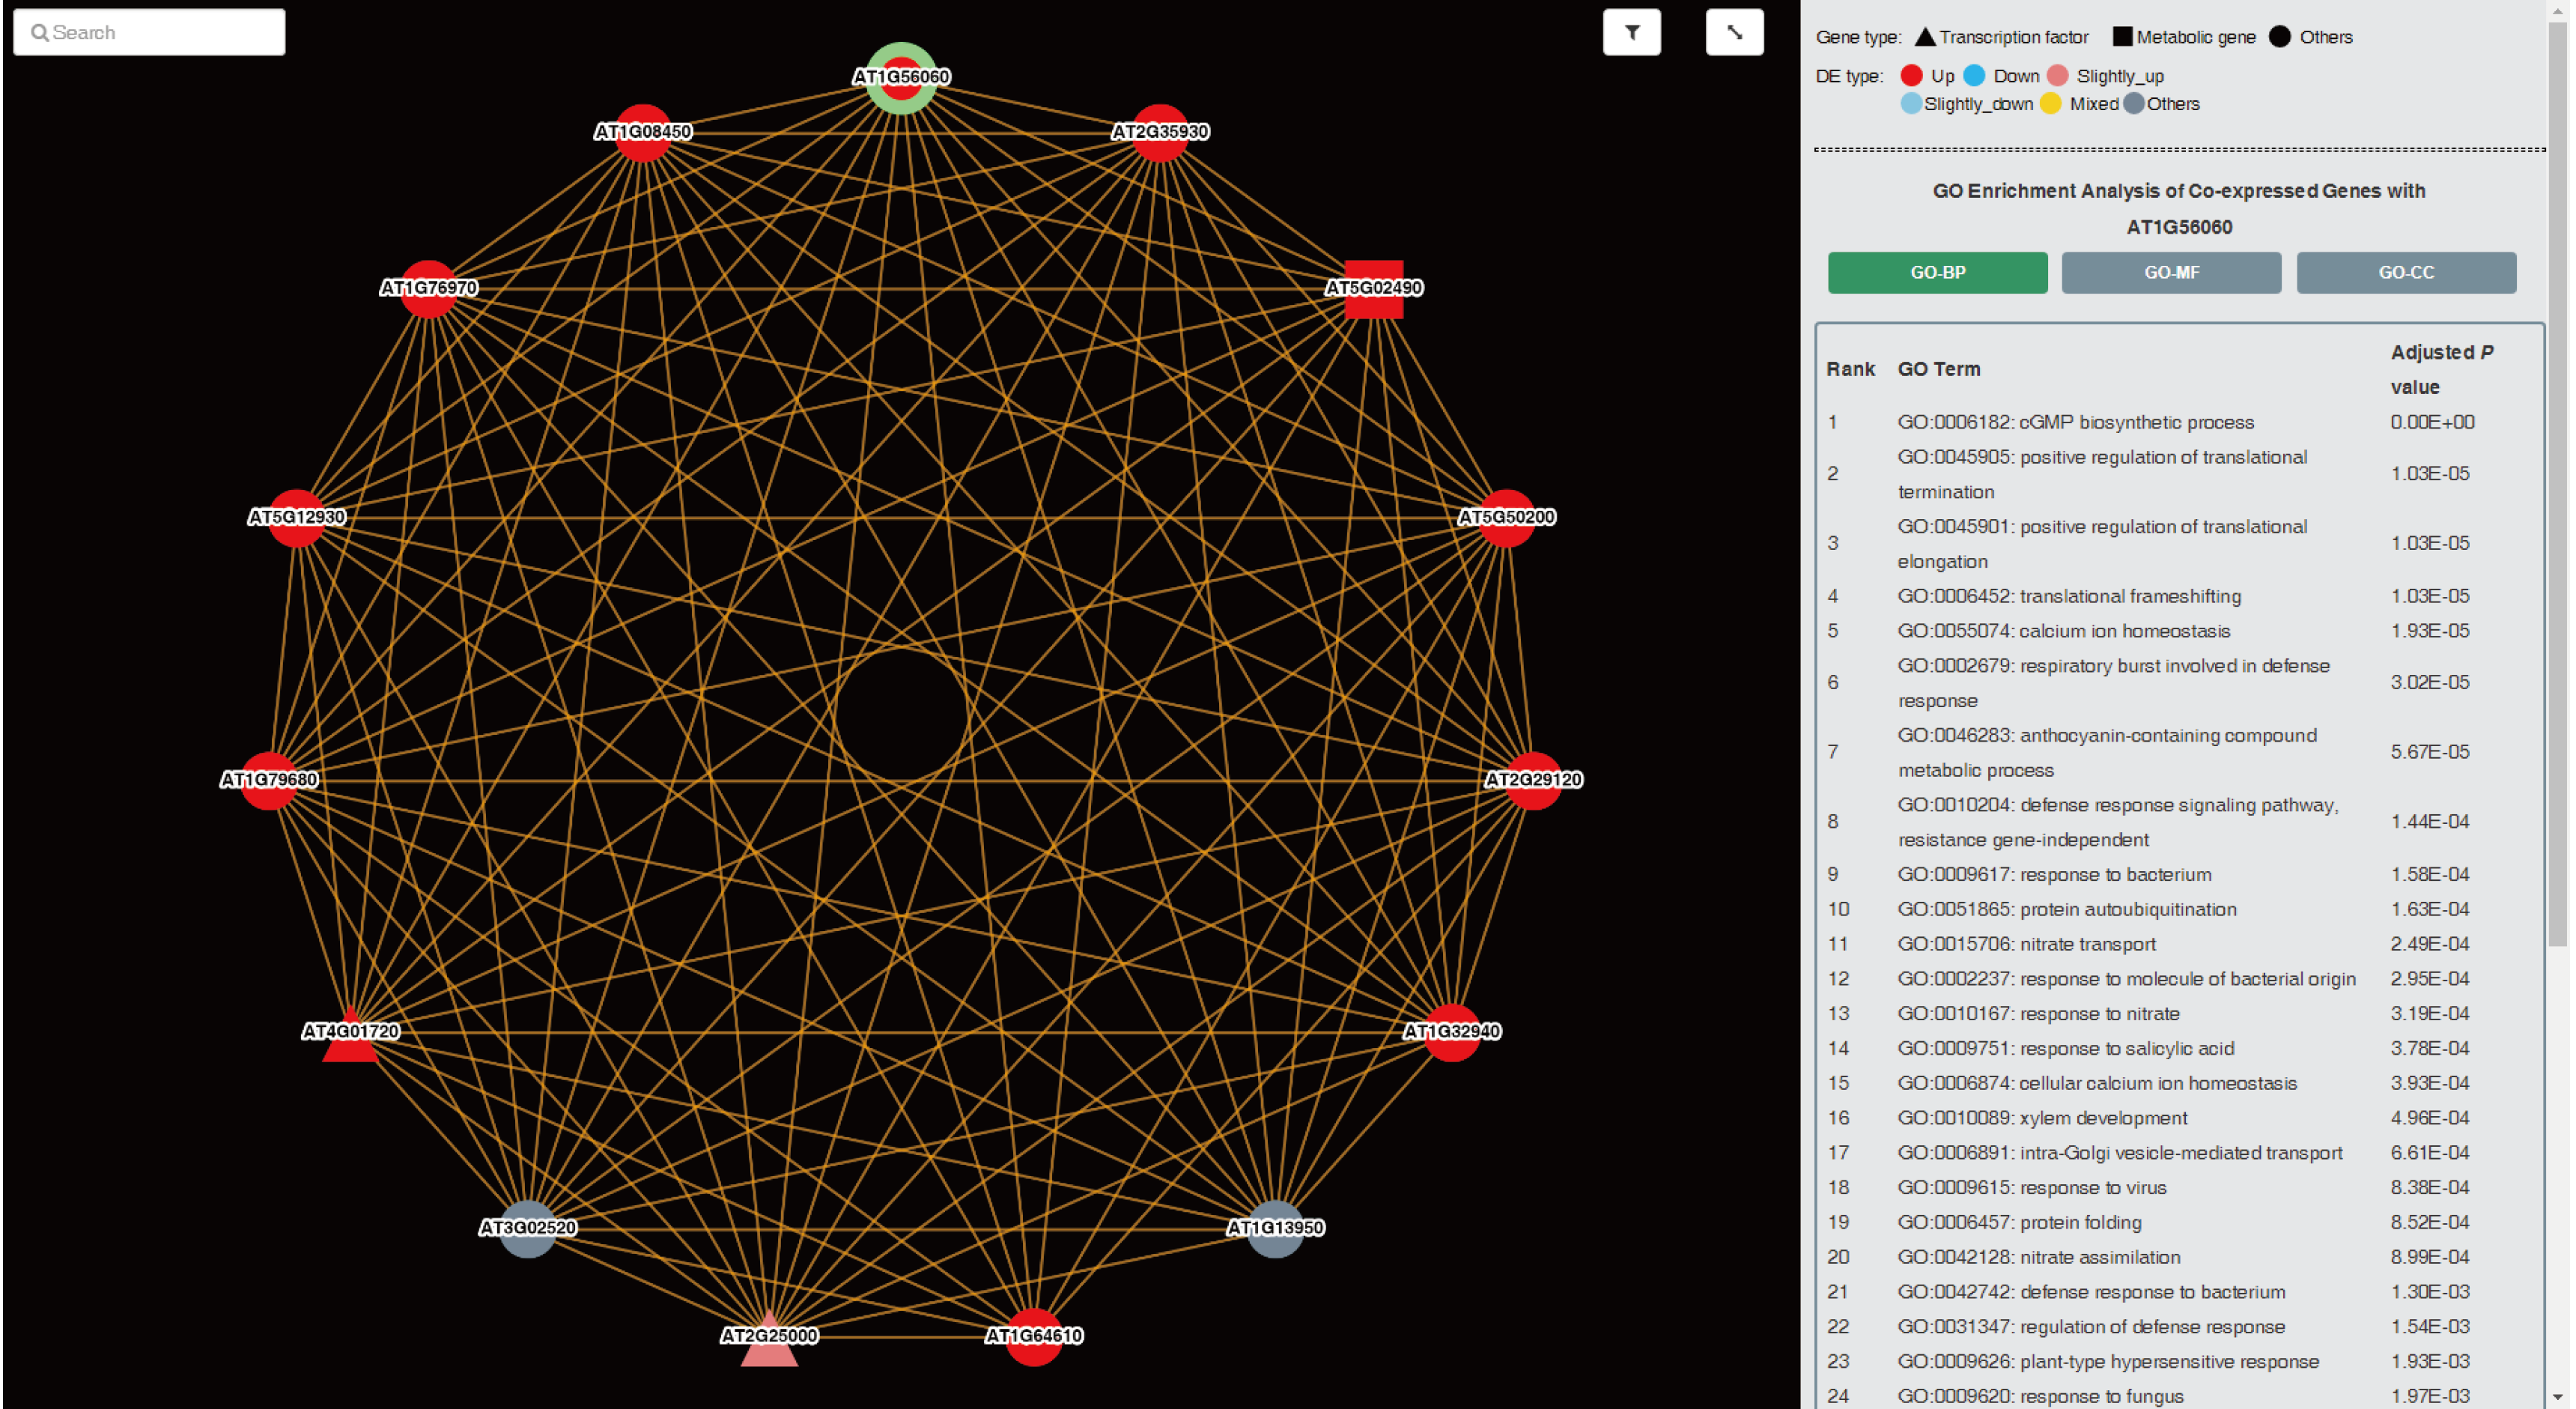
Tips:
up: consistency_score ≥ 0.7; down: consistency_score ≤ -0.7;
slightly_up: 0.3 ≤ consistency_score < 0.7; slightly_down: -0.7 < consistency_score ≤ -0.3;
mix: -0.3 < consistency_score < 0.3; other: it is not a feq_DEG.
2.3 Personalized and advanced tools
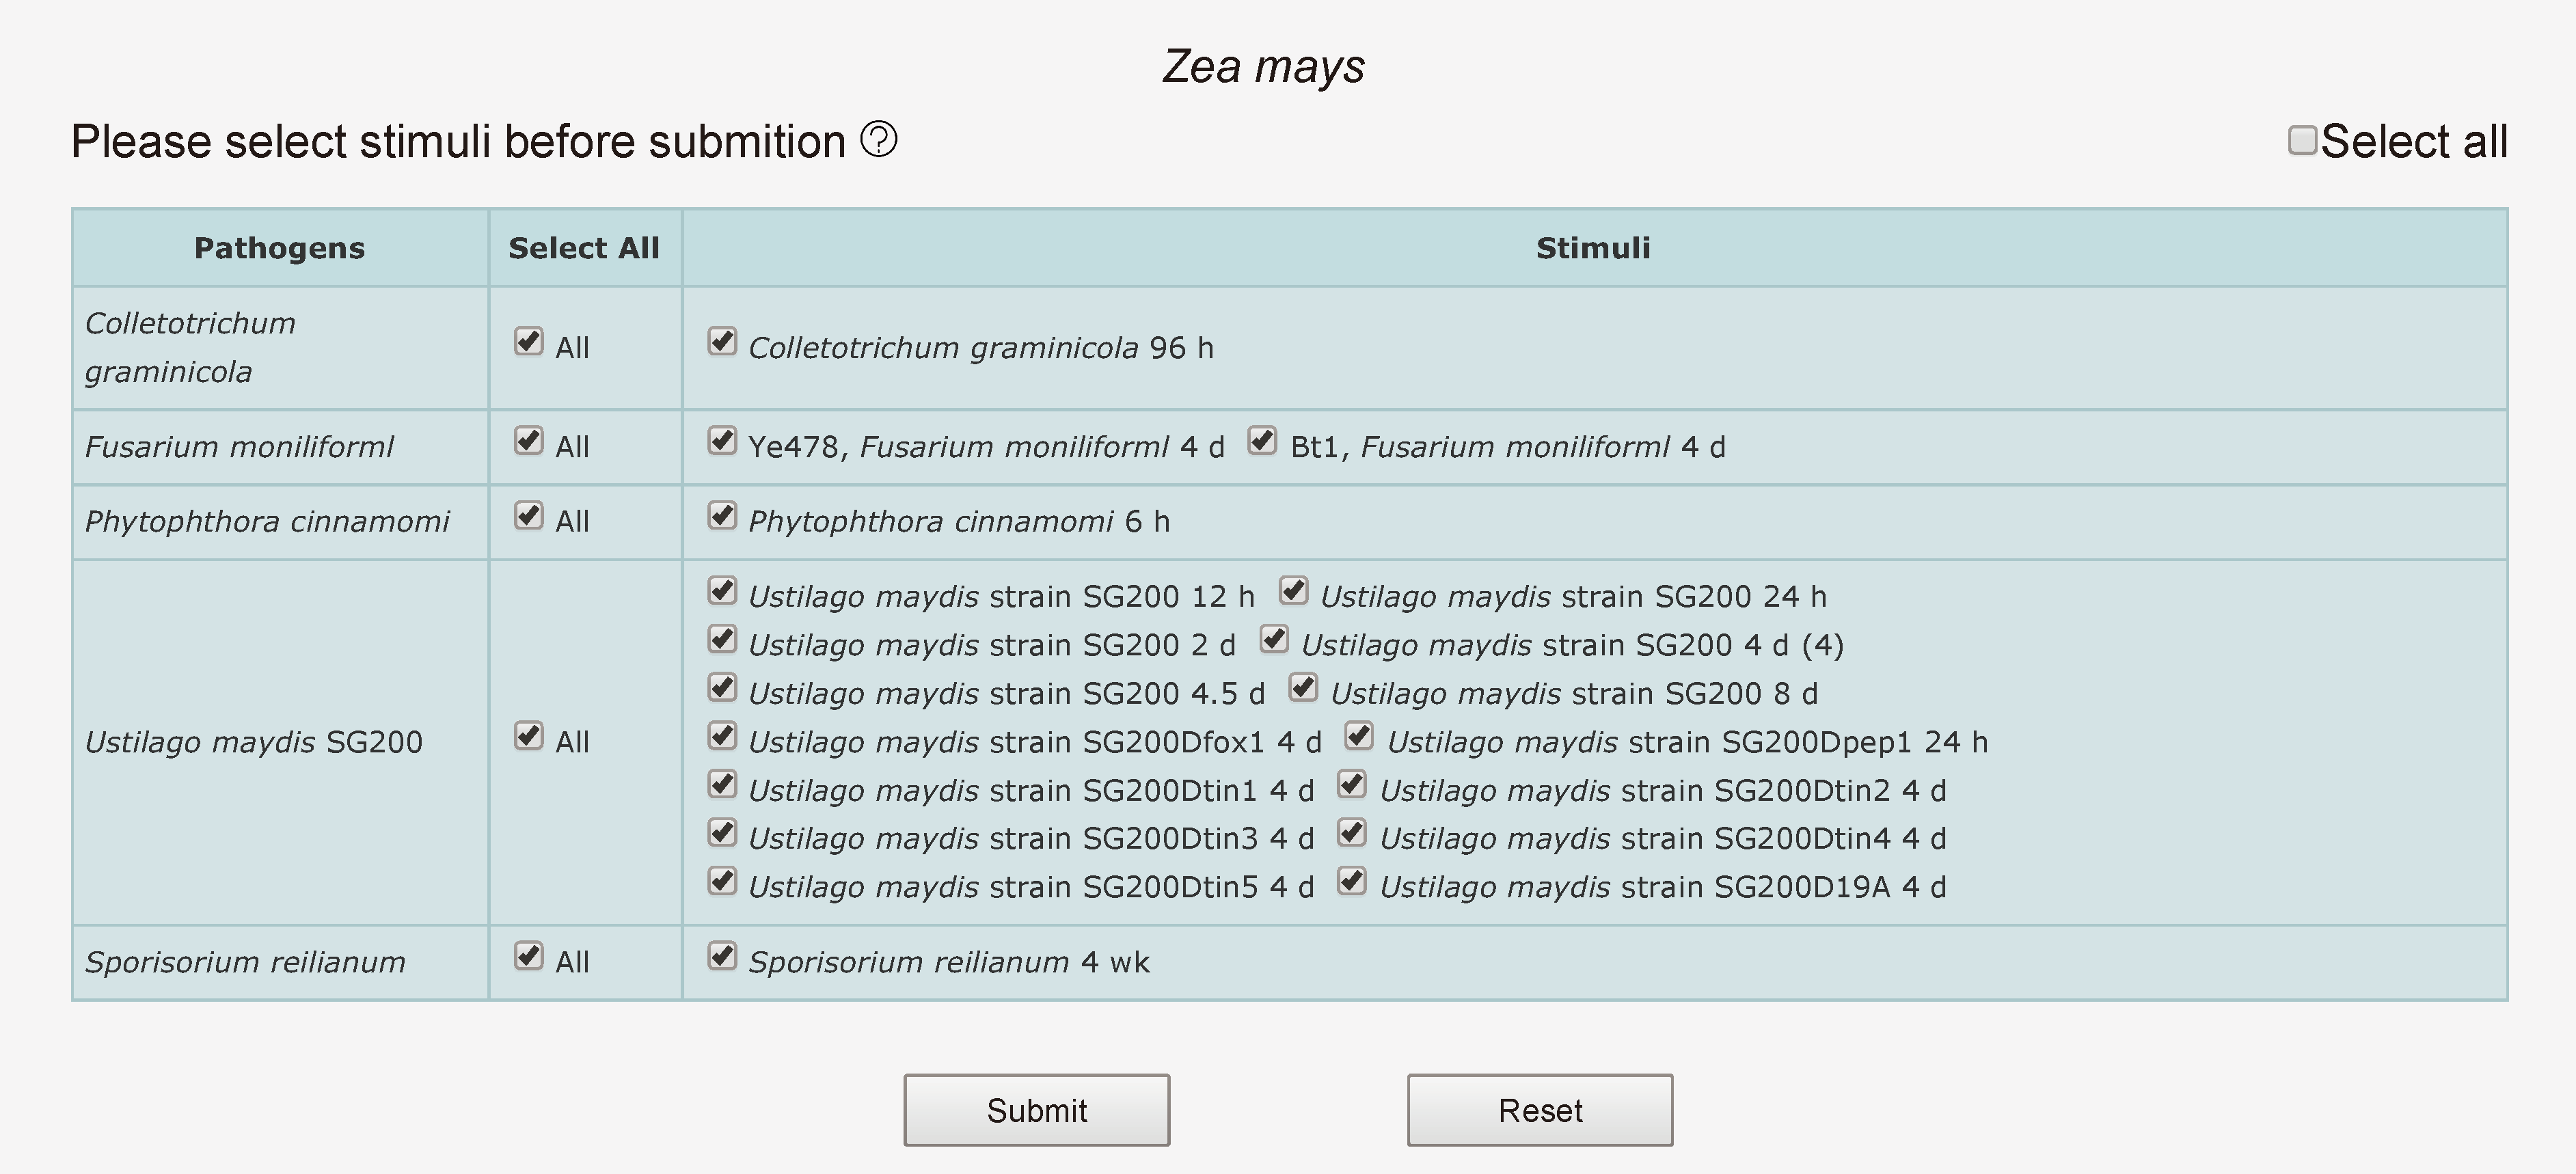
When mouse over "Gene Advance Search" of navigation bar, four plant species are shown. Click one species and choose it, then user should select interesting stimuli. After submitting selected stimuli, web server will query related DEGs from MySQL and count differentially expressed conditions of related genes. If users select a larger number of stimuli, a relatively long waiting time is required. The result list contains "gene", "conditions", "short description", "link", ordered by the number of differentially expressed conditions by default. In a word, this tool allows users to search co-regulated genes and the corresponding gene activities under the stress of various pathogens.
Besides, we also provide a tool for gene set search. Users can upload a list of DEGs from their own data and search those genes from PlaD. Searching results return DEGs already stored in PlaD as well as the corresponding frequencies of differential expression. At present, this function is only for Arabidopsis and rice.
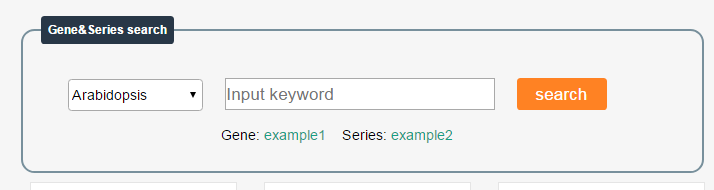
3 Keyword search
Users can search gene or series by keyword. Before search, plant species should be selected. The web provides two examples. example1 is an example of Arabidopsis gene search, example2 is an example of Arabidopsis series search.
Copyright © 2017 Ziding Zhang's Lab - China Agricultural University. All Rights Reserved.