1 What is PlaASDB?
2 Keyword search
3 A brief introduction to the results of searching
3.1 What does the result contain?
3.2 Gene
3.3 Transcription
3.4 Isoform
3.5 CoExperssion
4 How to cite?
1 What is PlaASDB?
PlaASDB is an alternative splicing database of plant responses to stress based on transcriptome data. The database currently includes two main species, Arabidopsis and rice . These two species have played an important role in scientific research as model crops and crops respectively. It aims to collect more comprehensive data to reveal the regulatory role of alternative splicing in response to stress. The stress types mainly include biotic stress and abiotic stress.
The database mainly shows the effects of alternative splicing at the gene, transcriptome and Isoform levels. The specific information of alternative splicing, gene expression and gene co-expression are displayed in the database.
PlaASDB is a free and user-friendly database. It does not require user registration or any configuration on local machines.
2 Keyword search
Users can search by GeneID or Gene name. Firstly, users need to select the species to be queried. Currently, the database contains two species, Arabidopsis and Rice. Secondly, users need to input the correct GeneID or Gene name. example1 is an example of Arabidopsis gene search, example2 is an example of Rice gene search.

3 A brief introduction to the results of searching
3.1 What does the result contain?
PlaASDB includes 2,703 RNA-Seq data sets of Arabidopsis, including 2,280 abiotic and 423 biotic stress experiments , and 552 RNA-Seq data sets of rice, including 410 abiotic and 142 biotic stress experiments. All the RNA-Seq samples were processed with a uniform RNA-Seq pipeline, and the TPM values of the genes and all transcripts were calculated using StringTie . PlaASDB Used ASTool to identify AS events and calculate PSI value for all samples.
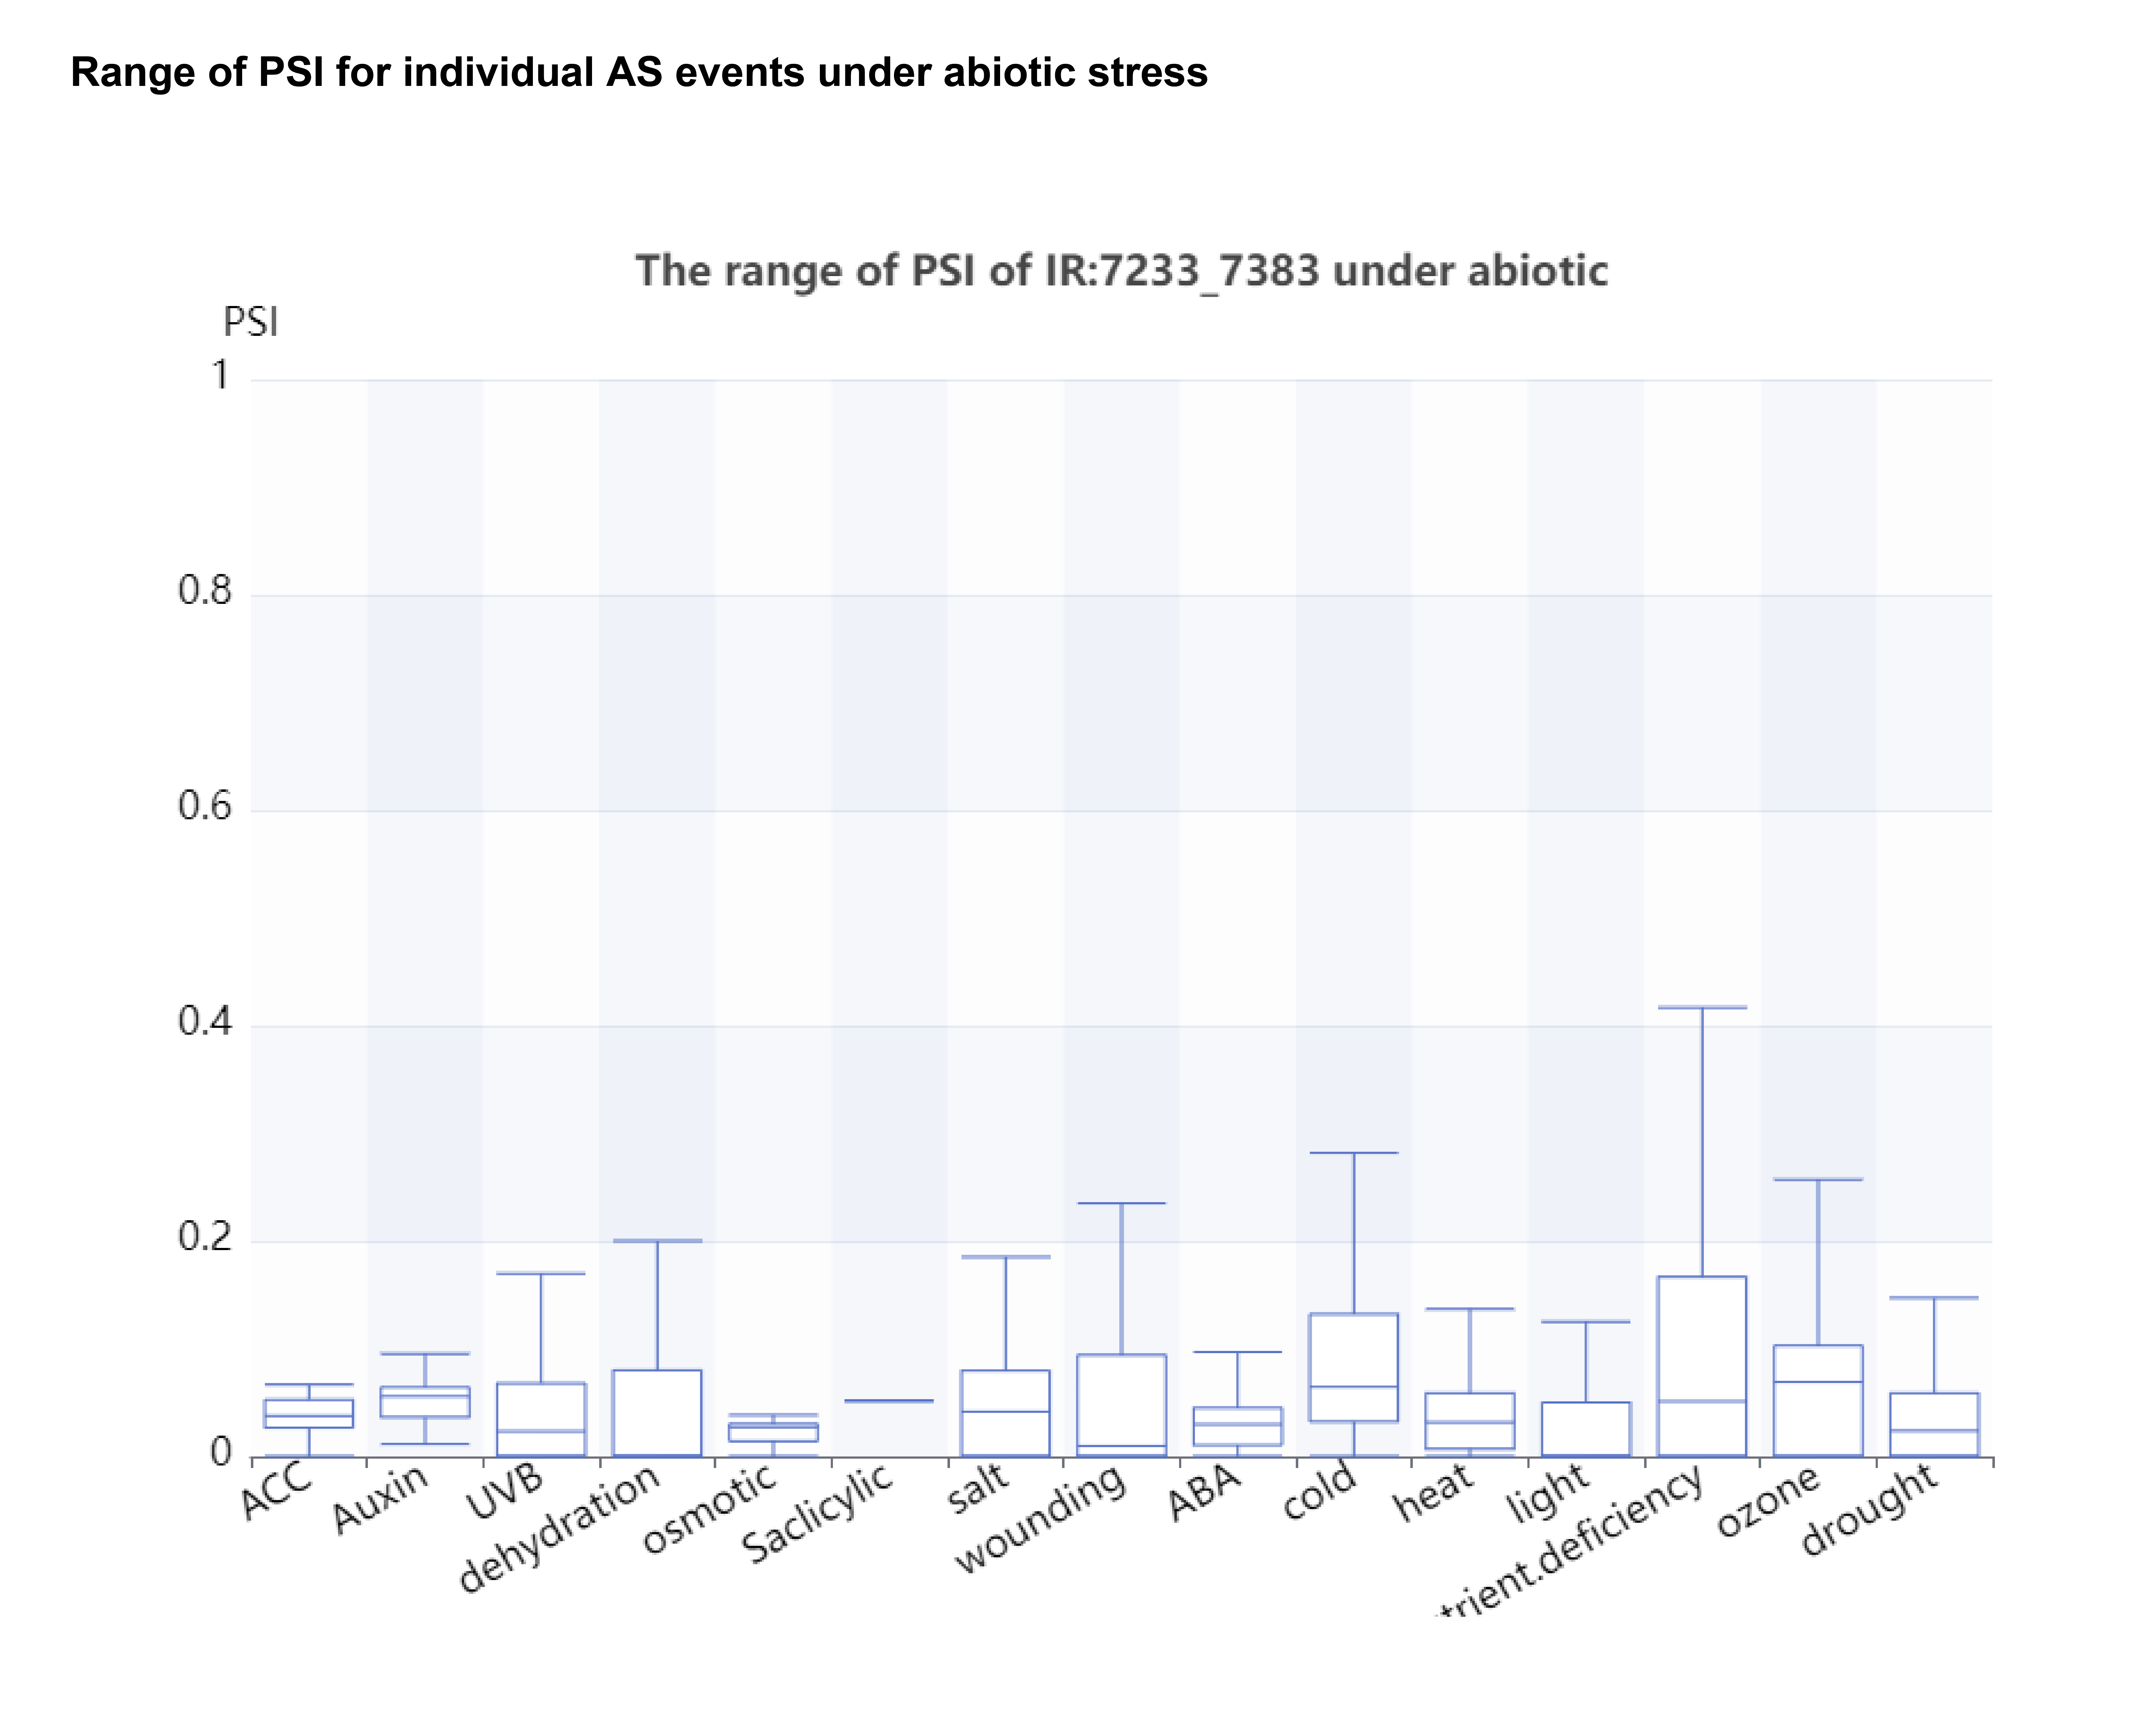
In the PlaASDB database, the range of PSI values of a query gene undergoing AS events under abiotic and biotic stresses is first shown. To this end, we removed control samples and selected only samples under stress conditions for display. According to the calculated PSI values, a boxplot is provided.In addition to providing an overview of the PSI range of individual AS events under different stress conditions, users can also select a single stress condition for customized display. When a stress condition is selected, both the stress condition and the control group in the samples are taken into account.
Similarly, PlaASDB provides TPM values of a query gene under different stresses, which only include samples under stress conditions. Moreover, the samples are classified according to different tissues, so that users can check the TPM values of the genes in different tissues after standardization.
Regarding the transcript information, users can obtain the transcript sequence and the TPM values of the whole transcripts under stress conditions. Here the control group is not included in these samples.
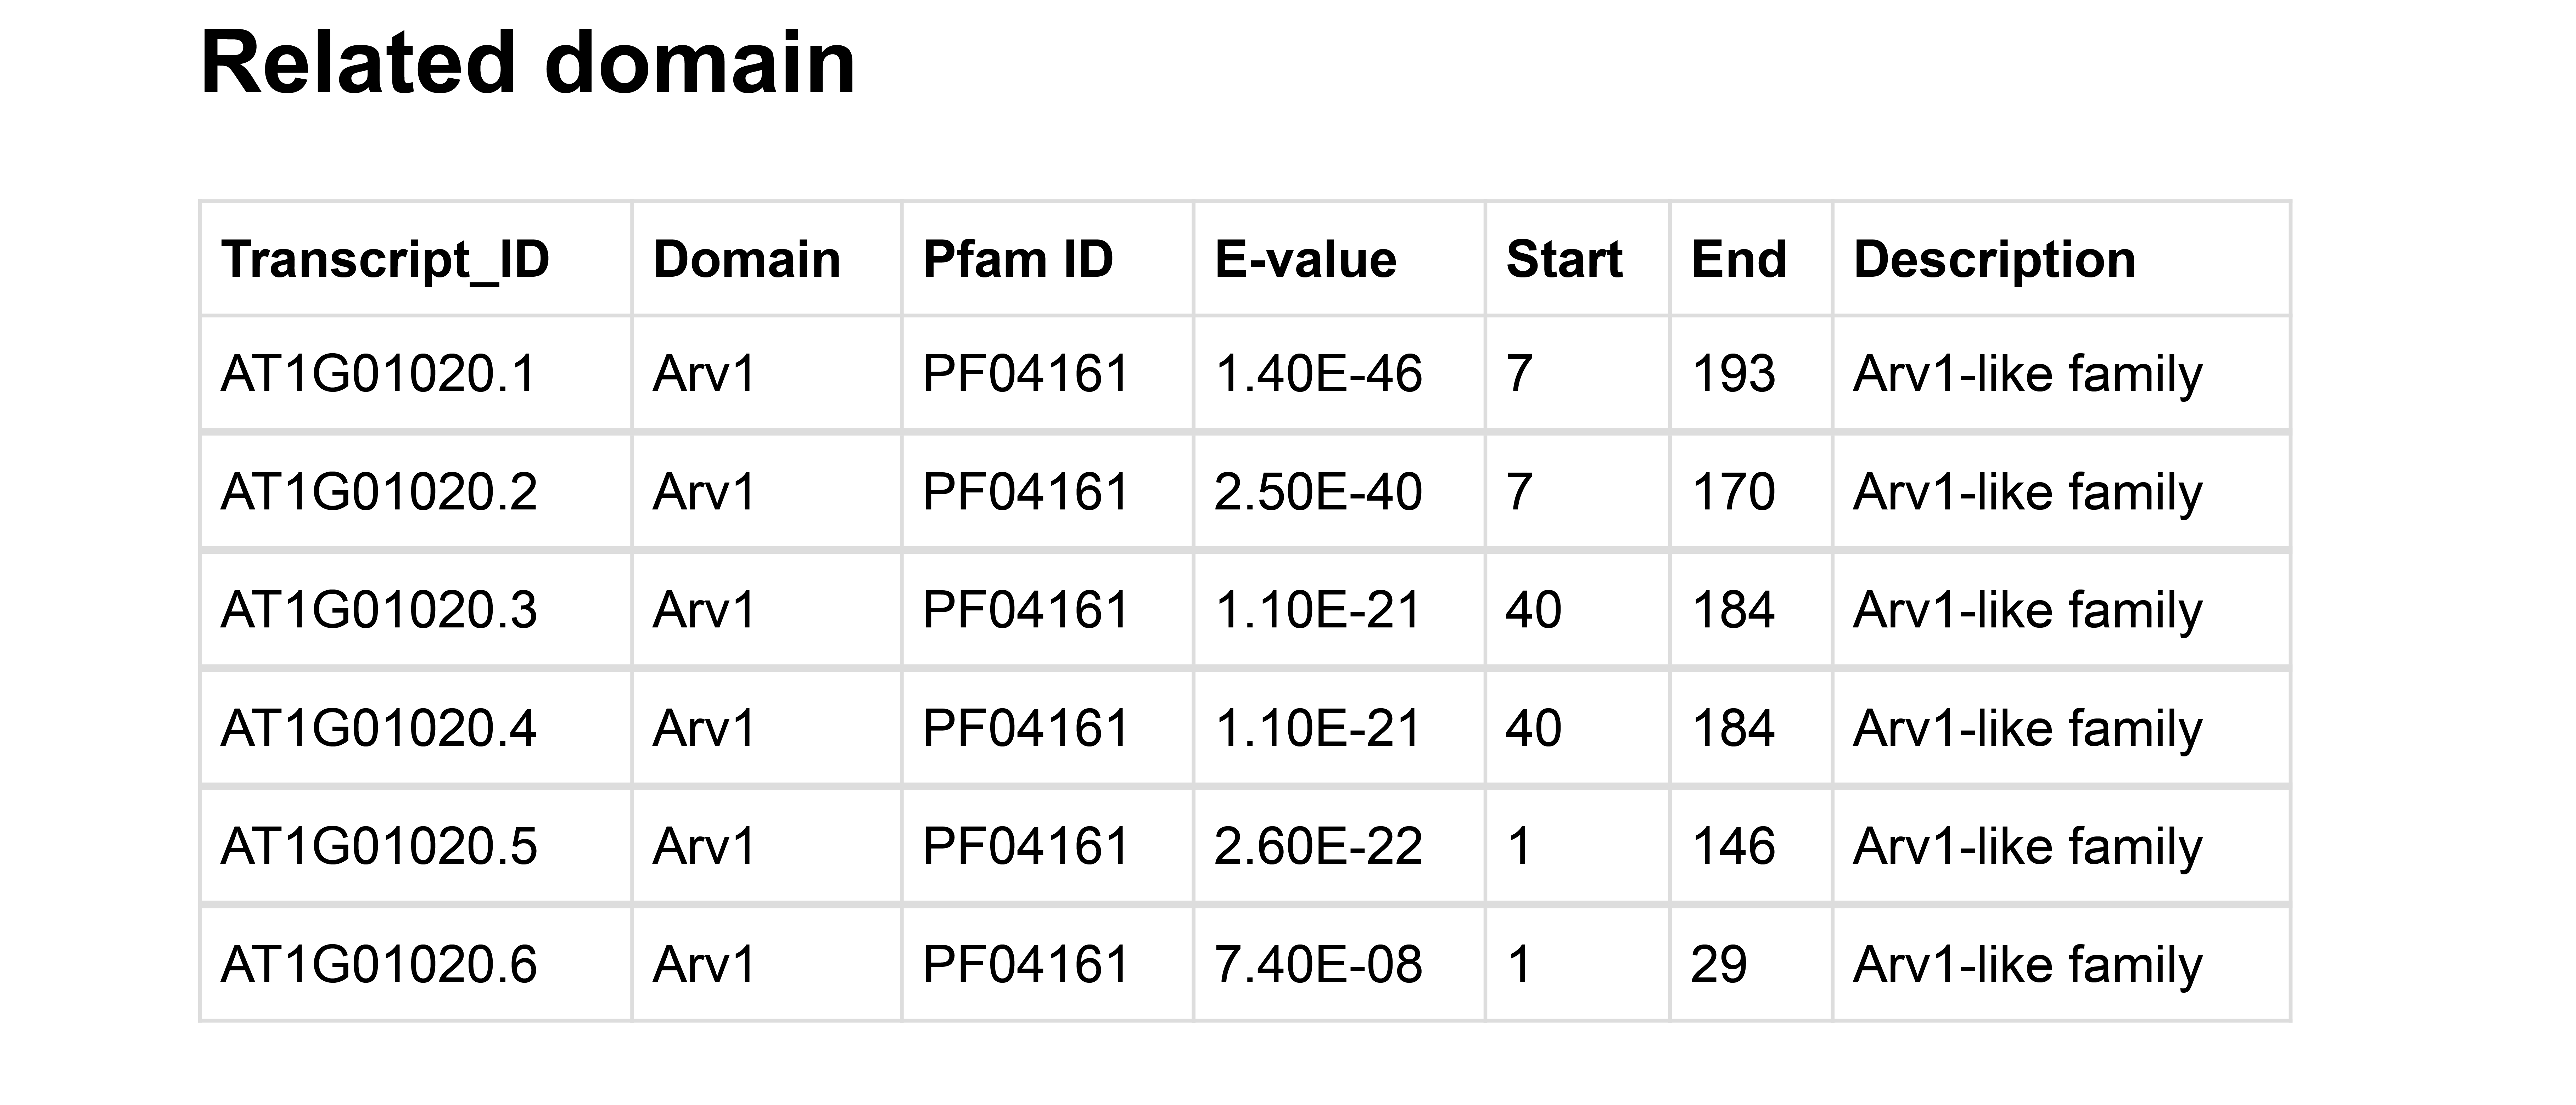
In addition, PlaASDB also provides CDS sequences, isoform sequences and GO annotations. At the same time, PlaASDB also identified the domain information contained in all transcripts . Finally, PlaASDB calculated co-expression networks of a query gene under abiotic and biotic stress.
All the sample information in PlaASDB can be obtained on the download page.
3.2 Gene
The first is the basic information of the target gene, which provides a gene browser based on javascript development. Then the Gene section provides specific information about the alternative splicing events involved in the target gene under biotic and abiotic stresses.

Users can expand the PSI range of each alternative splicing event under different stress by clicking the text in the red box, and the result is as follows:

Users can select the type of stress they are interested in by selecting the box below. This figure shows the comparison of PSI under stress with the control group.

Finally, the expression levels of target genes in abiotic stress conditions, biotic stress conditions and different tissues are shown in this section.
3.3 Transcription

Users can click on the name of each transcript to display the sequence information of each transcript
3.4 Isoform
Similar to 3.2, users can click the name of each CDS or Isoform to display specific sequence information.
Next, the domain contained in each Isoform is shown.

Finally, all the GO annotations involved in the target gene are displayed.
3.5 Co-Expression
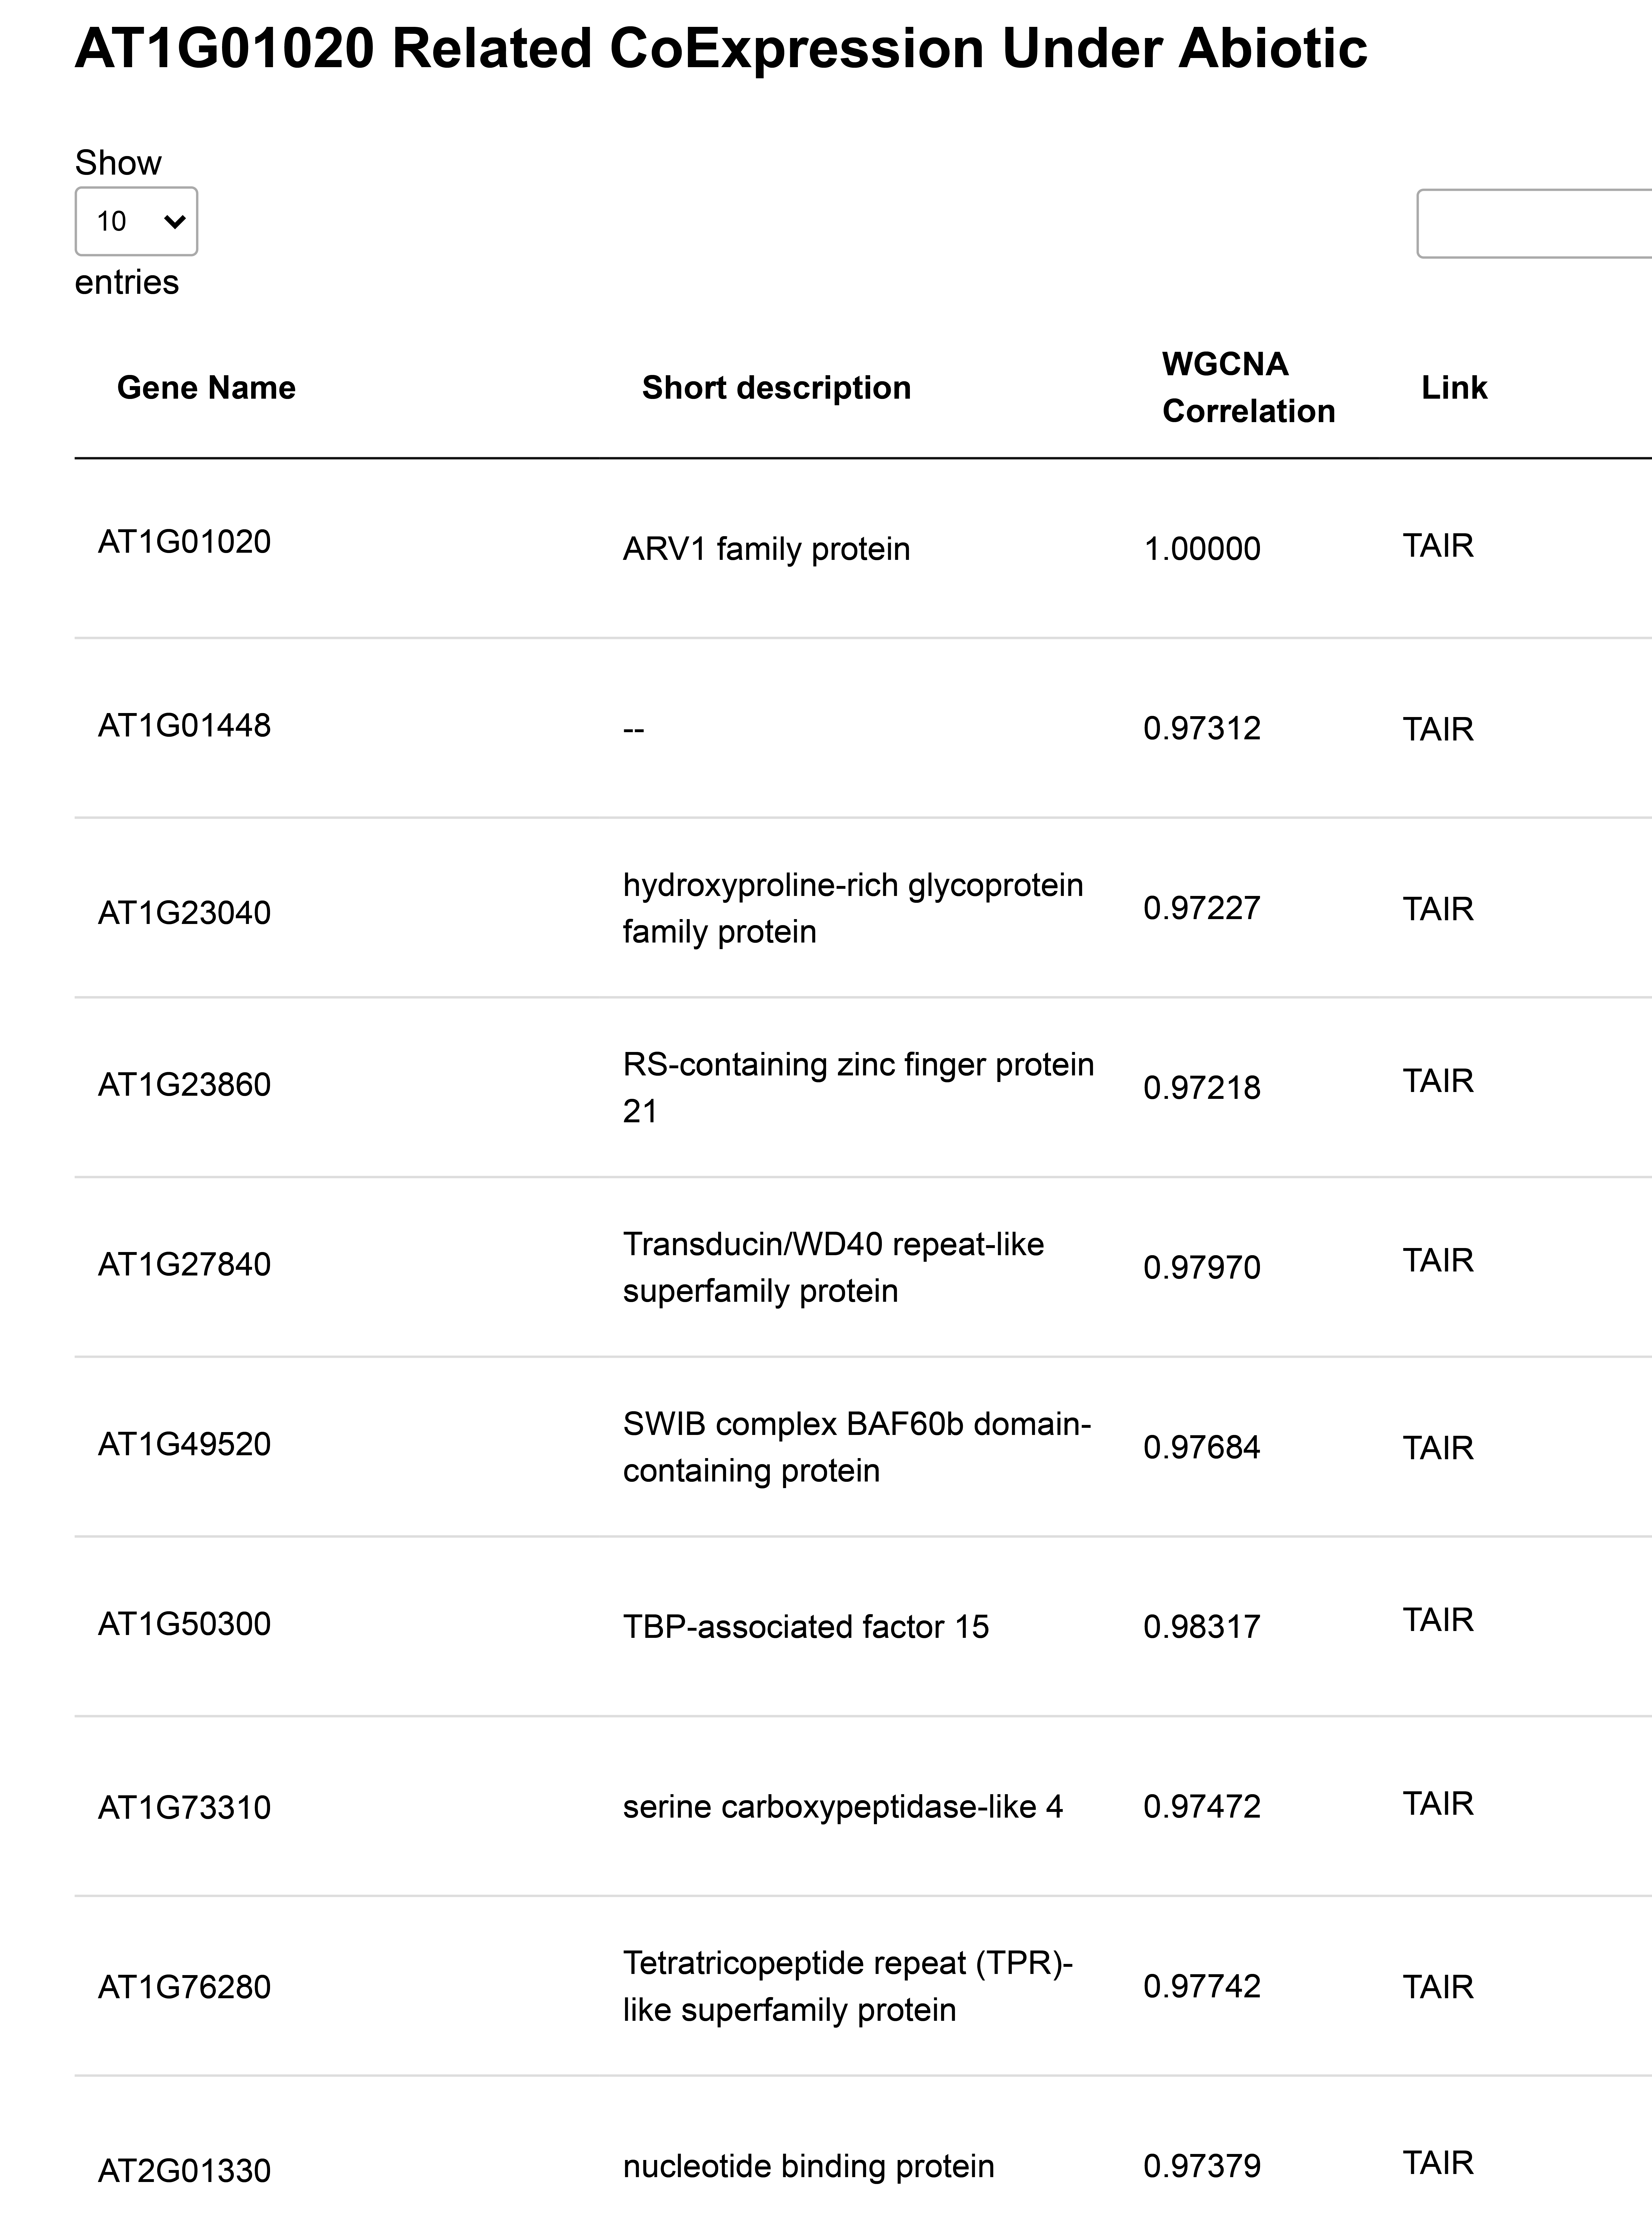
The top 50 co-expressed genes of target gene under abiotic stress or biotic stress are displayed.

4 How to cite?
Qi H, Guo X, Wang T, Zhang Z (2022) ASTool:an easy-to-use tool to accurately identify alternative splicing events from plant RNA-Seq data. International Journal of Molecular Science, 23(8):4079.
Guo, X., Wang, T., Jiang, L., Qi, H., and Zhang, Z. (2023). PlaASDB: a comprehensive database of plant alternative splicing events in response to stress. BMC Plant Biol 23, 225.
